
It’s been a wild few weeks for markets. Between a ‘hawkish rate cut,’ new tariff threats, and wrapping up the bulk of earnings season, stocks, bonds, and commodities have all made major moves. Precious metals rallied, interest rates dropped, and U.S. stock indexes fell below what had been important support. With the index below a key level, it’s a good time for a health check on the market leaders.
The Information Technology sector has been the most important driver of equity returns. After U.S. stocks peaked in January 2018, Tech continued to drive higher, setting new highs throughout the summer. Again this year, Tech set new highs in early April, weeks before the broader index. At more than 20% of the S&P 500’s market cap, it has the ability to make or break rallies. So after our most recent selloff, should we expect Tech to continue leading us higher?
The Systems Software Industry has been a big part of Tech leadership. It’s been in a strong uptrend for most of the last 5 years, and even now is well above an upward-sloping 200-day moving average. On the most recent pullback, it held its swing high from April, which also represents the 161.8% extension from the Q4 2018 decline. The next cluster of extensions to the upside lies near $2800. In order to reach that level, the industry will need to overcome a pretty big divergence in momentum. A sustained break of $2422 would indicate it needs to work off the divergence before it can resume its trend higher.
Data Processing has been just as strong, and it looks about the same. The upside extensions are just over $1400, while near-term support is at $1216. The momentum divergence is concerning, but, similar to Systems Software, managing to stay out of oversold territory on the most recent pullback is a sign of strength.
Another group that falls into the same category is Internet Services and Infrastructure. Again, momentum diverged at the most recent highs, but prices are still above support. The risk-level to watch is $936, with $1100 looming as a possible upside target in the near-term.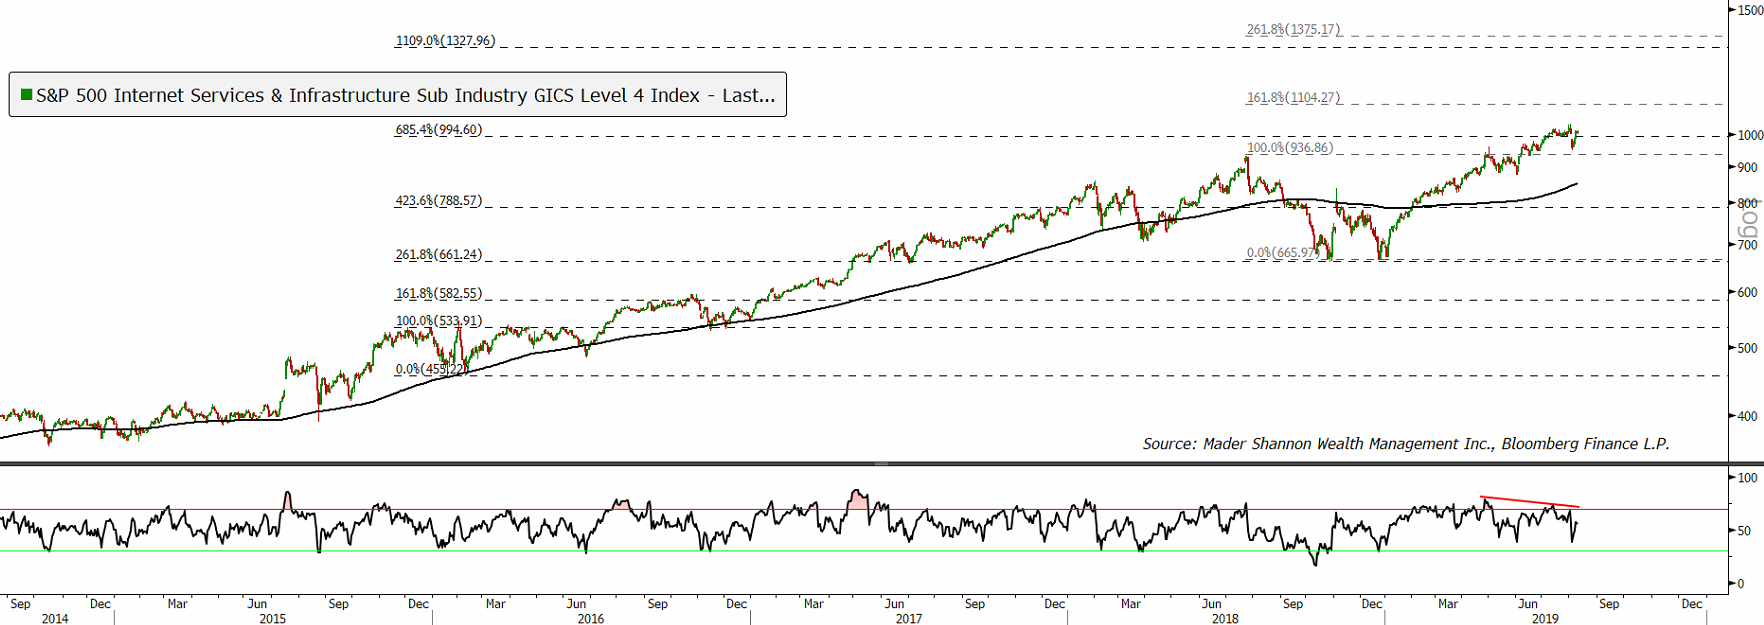
The damage to Communications Equipment was more meaningful. The industry is still trading above an upward-sloping moving average and major support from the 2018 highs, but momentum is flashing a warning sign. Prices never even got overbought on the most recent high, and dropped into oversold for a second consecutive time last week. It could take some time to work off these issues, but as long as it stays above support near $225, the long-term uptrend will remain intact. If the price can get back above $258, the extensions at $300 are within reach.
The Application Software industry got rejected at the intermediate and shorter-term extension cluster near $220. Momentum had diverged as the group set its most recent high, and then got oversold on the pullback. The long-term uptrend is intact above $194, but it might take some time to improve momentum’s signature before it heads to higher levels.
Semiconductor Equipment stocks were some of the weakest last year. They peaked in the second quarter and were nearly cut in half by the December lows. But momentum diverged positively at the December lows, and since that false breakdown, the industry has headed much higher. Momentum is now in a bullish regime, and prices have managed to hold important support at $1040. Working through resistance from last year’s top will be no easy task, but if Semi Equipment can reestablish itself above $1200, the next extensions are quite a bit higher.
Several industries lack a clear trend. Both Semiconductors and Electronic Equipment Instruments are trading near flat 200-day moving averages. In both cases, momentum is sending mixed signals, and the trading ranges are pretty clearly defined.

Technology Hardware, Storage and Peripherals is fighting to stay out of a downtrend. The 200-day moving average is downward-sloping, but prices have spent most of the past few months trading back above it. The false breakout in July and momentum’s failure to get overbought are trouble for bulls, but after more than a year of mostly sideways trading, there are plenty of near-term support levels. This chart is likely to stay messy until a break of the trading range is confirmed by momentum.
On the whole, Tech is still pretty healthy. Uptrends remain intact for the strongest industries, and one of the weakest has seen substantial improvement. Momentum, though, is sending caution signals in nearly every group. It might just take some time to clean up the divergences, but we have clearly defined support levels that will give us a heads up if the trends are changing.
See things a little differently? Let’s talk about it
Nothing in this post or on this site is intended as a recommendation or an offer to buy or sell securities. Posts are meant for informational and entertainment purposes only. I or my affiliates may hold positions in securities mentioned in posts. Please see my Disclosure page for more information.