
The Grindstone Intelligence Sector Outlook is based on our top-down technical approach. These ratings reflect our views over the coming month.
Sector Ratings and Model Portfolio Update
The Grindstone Intelligence Sector Outlook is based on our top-down technical approach. These ratings reflect our views over the coming month.
Sector Ratings and Model Portfolio Update
The Grindstone Intelligence Sector Outlook is based on our top-down technical approach. These ratings reflect our views over the coming month.
Sector Ratings and Model Portfolio Update
The Grindstone Intelligence Sector Outlook is based on our top-down technical approach. These ratings reflect our views over the coming month.
Sector Ratings and Model Portfolio Update
The Grindstone Intelligence Sector Outlook is based on our top-down technical approach. These ratings reflect our views over the coming month.
Sector Ratings and Model Portfolio Update
The Grindstone Intelligence Sector Outlook is based on our top-down technical approach. These ratings are based on our views over the next coming month.
April Technical Market Outlook
The first quarter of 2023 stands in stark contrast to the lived experience of 2022. Last year, stocks were ravaged by a valuation-led bear market, bonds had their worst year in memory, and inflation cut into already poor nominal returns. We’re only three months in, but the growth-oriented NASDAQ has already jumped more than 16%, the S&P 500 is up 7%, and bond prices are rising. So is the bear market firmly in the rearview mirror?
US Equities
Each month we take a top-down look at the US financial markets and ask ourselves: Is this a time to buying stocks and increasing our exposure to risk? Or are we better served looking for stocks to sell and finding alternative places to invest?
For most of this year, we’ve been reluctant to answer that question with any conviction. On one hand, indexes are well off their October lows, and the rally has lasted longer and risen further than what is typically seen during bear market rallies. On the other hand, the largest US stock indexes remain stuck below key overhead resistance. And while the list of stocks hitting new 52 week lows peaked last summer, we’ve yet to see a resurgence in the list of stocks setting new highs.
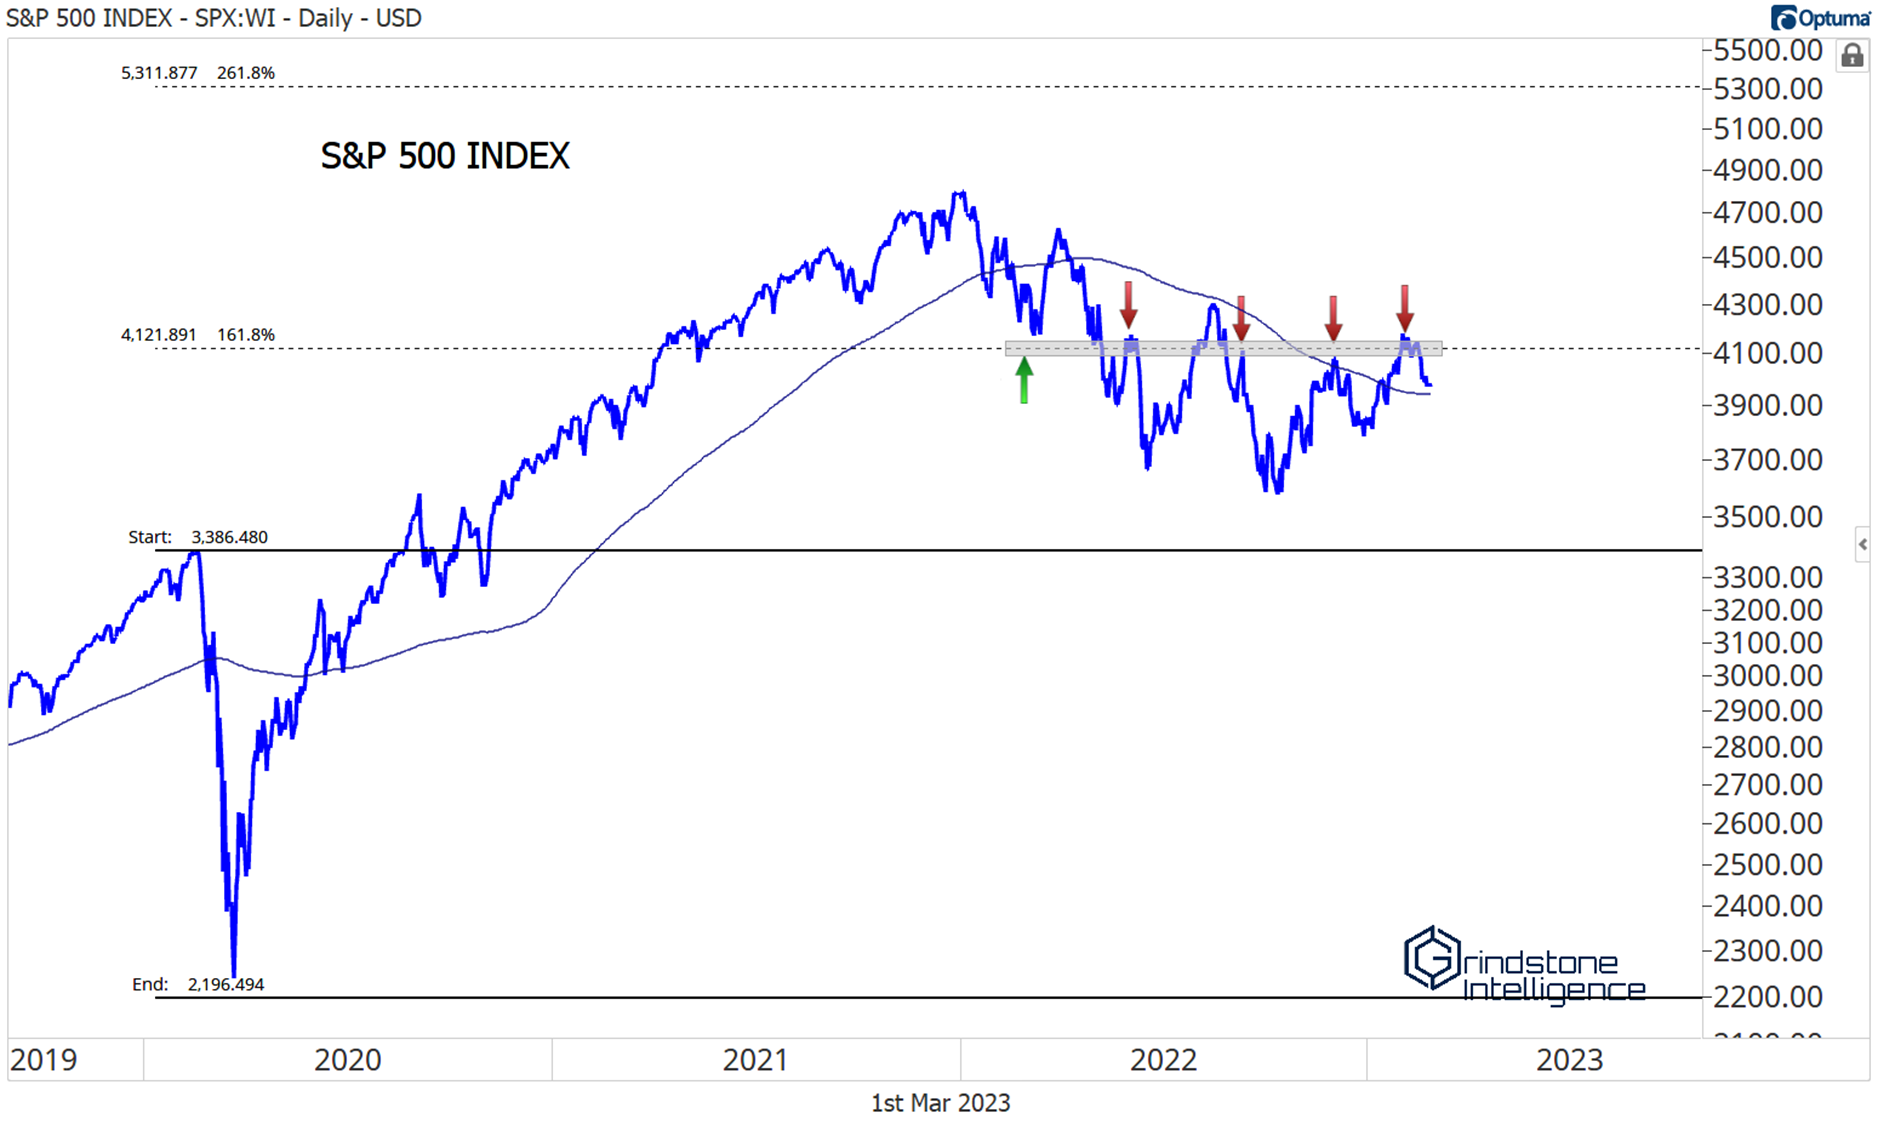
The S&P 500 is trying to get through the 4100-4200 level for the fifth time. This has been our line in the sand all year, and there’s no reason to change that approach now. It’s the 161.8% retracement from the 2020 decline, and it also marked a key low early last year, before the bear market really got going. It’s been resistance for 10 months.

If the S&P is above its February highs, we’ll have much more confidence that this is indeed a new bull market.
The same goes for the NASDAQ. The resistance area we’re watching here is from 11800-12200. These aren’t just numbers we’re pulling out of a hat – 12000 is the 161.8% Fibonacci retracement from the entire COVID selloff. The market respects these Fib levels, so we do, too.
But it’s not just weird rabbit math that has us watching that level. It’s also where growth stocks peaked relative to value. In September 2020, growth stocks – which dominate the NASDAQ – ended a near 15-year run of outperformance relative to value.

Another strong week like the last, and both of those indexes will be above our key levels. In that scenario, where could prove our bullish thesis wrong? Weak breadth.
Most stocks have lagged index returns so far this year, and by a wide margin. The equally weighted S&P 500 has underperformed the cap weighted index by 6% since mid-January.

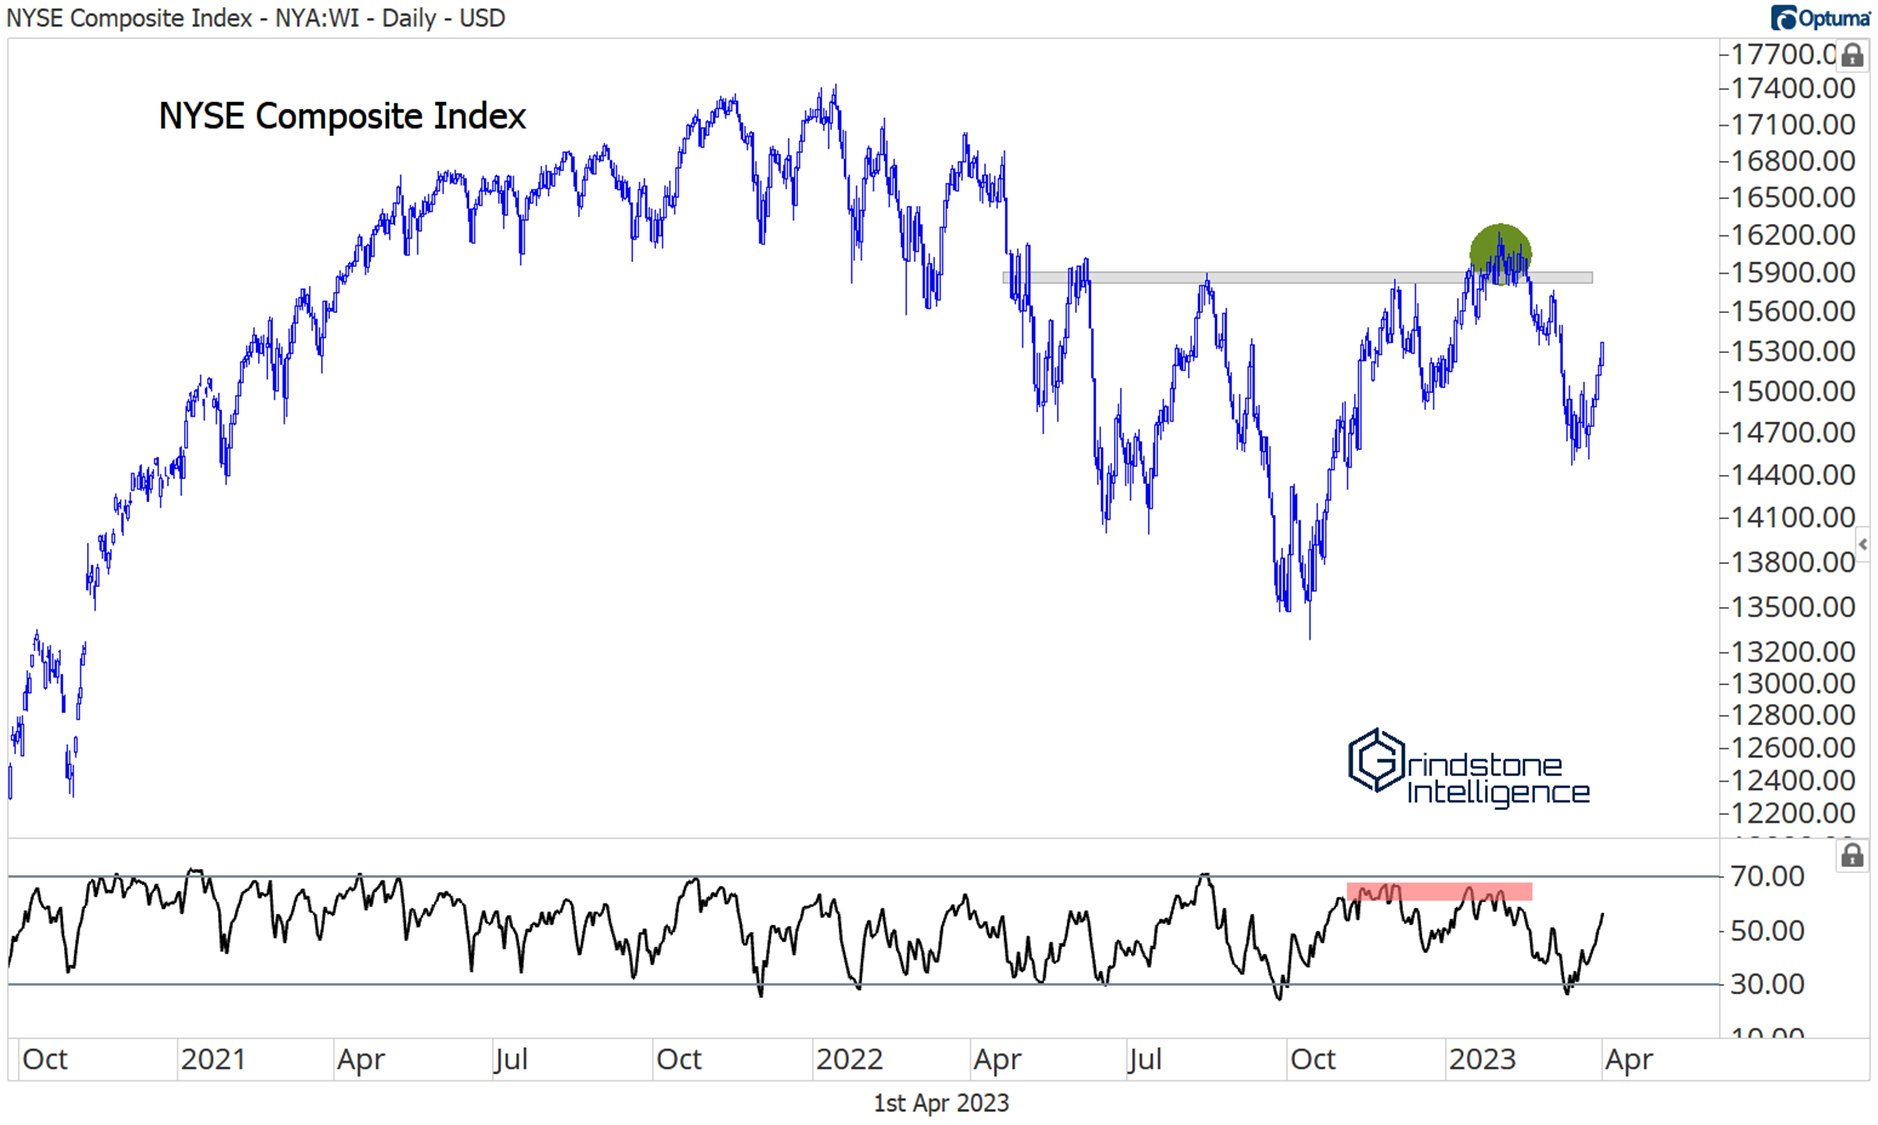
That’s not entirely unusual. It just means the biggest stocks (which all happen to be growth stocks) are rising faster than smaller ones, and we already knew that growth was driving this year’s returns. Outside of growth names, though, the trends are far from awe-inspiring. The NYSE Composite was setting new 3-month lows just a few short weeks ago, and momentum is in a bearish range.
But a lack of upside participation is different from outright negative leadership. Last month, we lamented the weakness in the Dow Jones Industrial Average and said prices needed to get back above 33000 in a hurry. They did just that:

The Russell 2000 tested its bear market lows. But it held those lows.

We favor a neutral approach to equities unless the S&P 500 is above 4200 and the NASDAQ has comfortably cleared 12200. In that scenario we need to be positioned for higher stock prices. That doesn’t mean we need to be indiscriminately buying everything we see – we still want to be selective. But unless the situation in value deteriorates further, there just isn’t much technical evidence to support a bearish approach.
View the rest of our April outlook:
April Technical Market Outlook
(Premium) April FICC Outlook
(Premium) April Information Technology Outlook
(Premium) April Communication Services Outlook
(Premium) April Consumer Discretionary Outlook
(Premium) April Industrials Outlook
(Premium) April Financials Outlook
(Premium) April Energy Outlook
(Premium) April Materials Outlook
(Premium) April Health Care Outlook
(Premium) April Consumer Staples Outlook
(Premium) April Real Estate Outlook
(Premium) April Utilities Outlook
Premium members can log in to see our sector ratings and US Equity Model Portfolio below.
March Technical Market Outlook
February lived up to its reputation as one of the worst months of the year. Since the inception of the S&P 500 Index in 1950, stocks have averaged a negative return during the month. Only September has a worse track record. This year, stocks followed their seasonal pattern, as the S&P 500 dropped 2.6%, the Dow Jones Industrial Average fell 4.2%, and the NASDAQ Composite fell just more than 1%. Let’s take a look at how things are shaping up for March.
US Equities
Each month, we start our journey from the top, looking at the market from 30,000 feet up and focusing only on the biggest indexes. In just a handful of charts, we can see exactly the type of investment environment we’re in. Are stock prices rising or are they falling? Should we be erring on the side of buying or selling stocks?
Last month, our view was that stocks had made significant progress toward ending the bear market that began in 2022. Here’s how we put it:
We aren’t out of the woods yet, but we think we see the light at the edge of the forest.
The beauty of technical analysis is that prices offer us clear risk levels – we know exactly where we’re right and where we’re wrong. We entered the month with a clear view of what we needed to keep an eye on:
Small Caps are the ones to watch. With the last few days of gains, the Russell 2000 is above its own key area of resistance. That’s a good sign – small caps were the first to find a bottom last year and could very well lead us higher in 2023. But if IWM is back below 190, expect the rest of the major US indexes to be failing, too.
Well, the IWM fell back below 190. And the rest of the major indexes fell, too.
(Editor’s note: If you’re having trouble seeing any chart in this report, click on it to view a larger version)

We still aren’t out of the woods.
For months, we’ve been talking about resistance near 4100 for the S&P 500. That was our line in the sand – if prices were above that, we wanted to be buying stocks. If they weren’t, we believed a cautious approach was more appropriate.
Nothing changed during February. Stocks failed once again at 4100, and the bears still have the upper hand.
It’s the exact same situation for the NASDAQ. The level here is 12000.

These aren’t just numbers we’re pulling out of a hat. 12000 is the 161.8% Fibonacci retracement from the entire COVID selloff. The market respects these Fib levels, so we do, too.
But it’s not just weird rabbit math that has us watching that level. It’s also where growth stocks peaked relative to value. In September 2020, growth stocks ended a near 15-year run of outperformance. The NASDAQ, which is dominated by those same growth names, is paying attention.

There’s no reason to be aggressively buying stocks as long as we’re below those key levels. We know exactly where we want to be more bullish. So what would it take for us to shift from neutral to outright bearish on US stocks?
We’d need to see more indexes acting like the Dow.
The Dow Jones Industrial Average did more than just fail at overhead supply during February: it ended the month by breaking its December lows. This chart is the biggest threat to the bull case for stocks. If the index that’s been the leader for more than a year is now setting new lows, how can we be buying stocks?
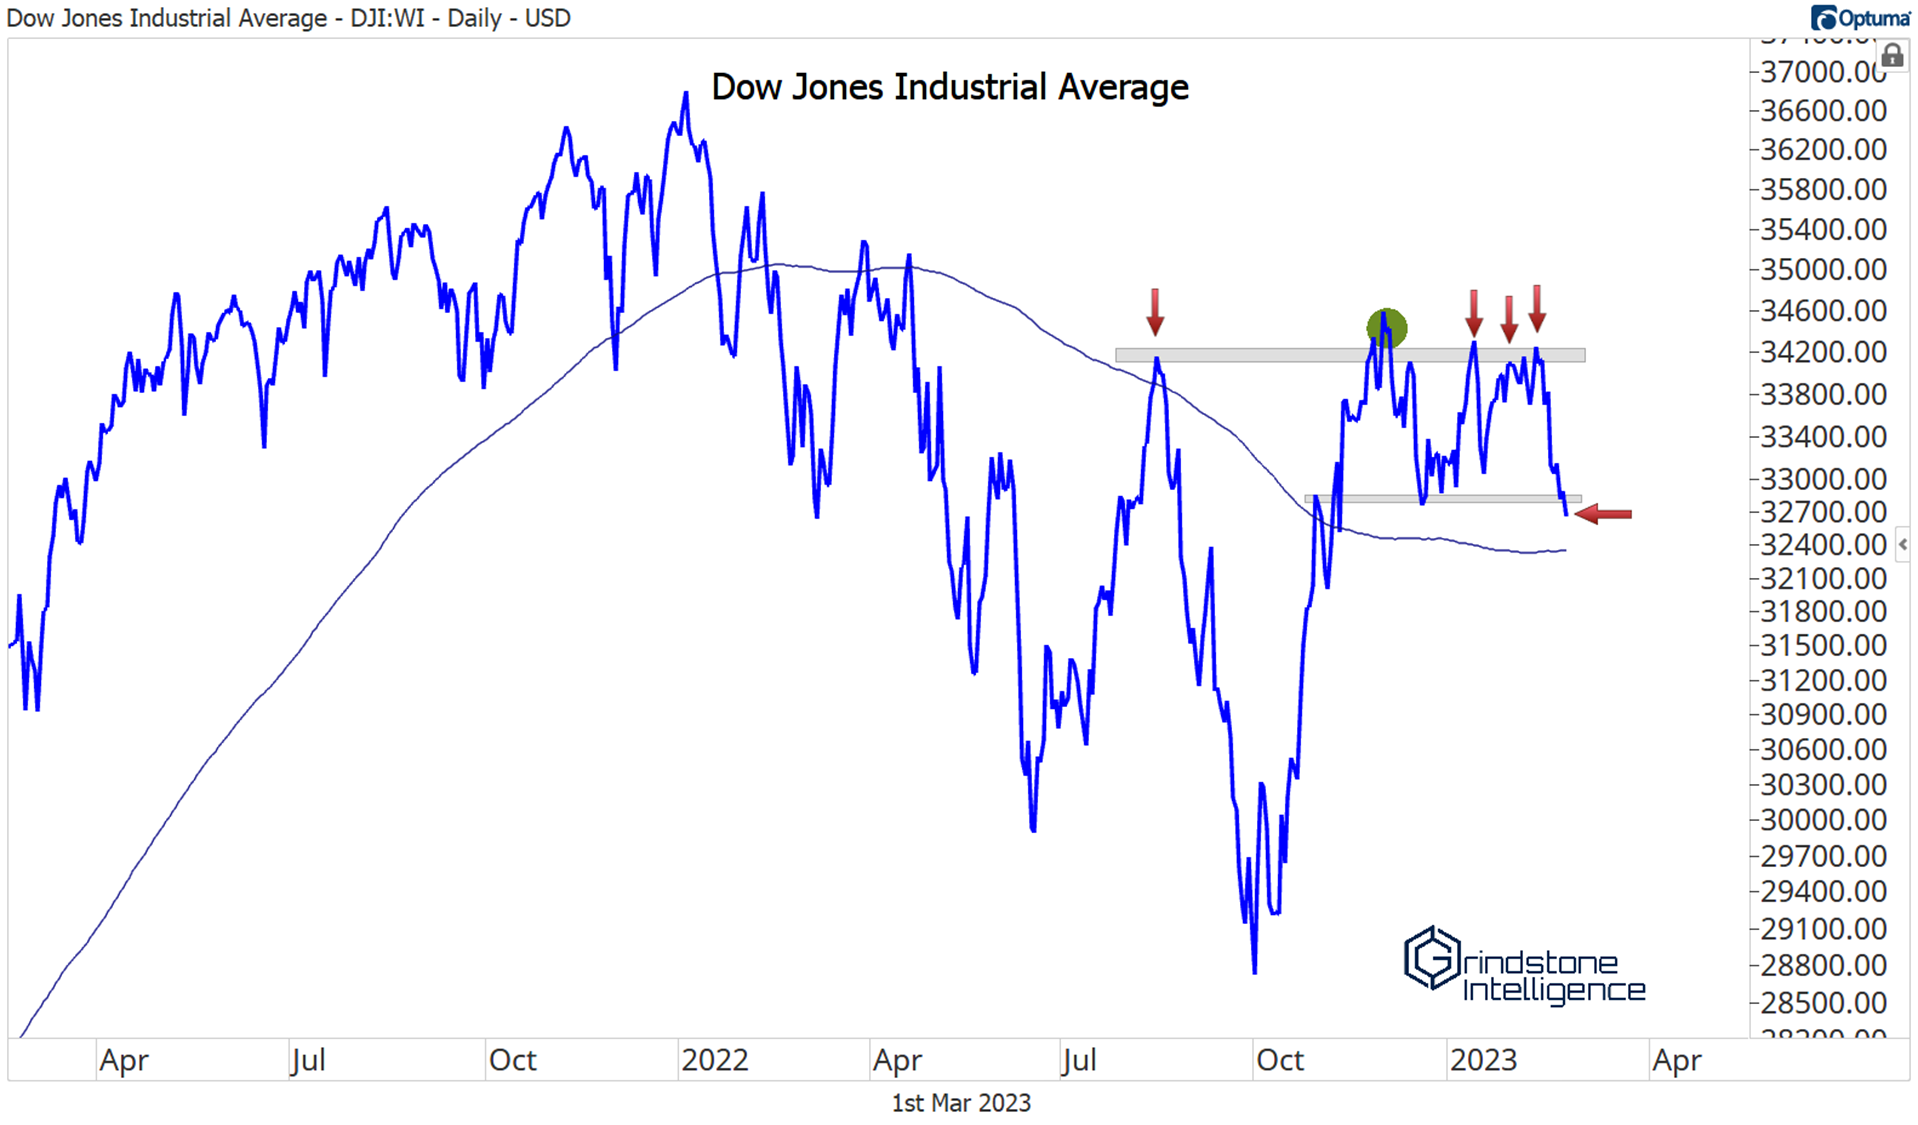
The Dow needs to get back above 33000 in a hurry. If it does, that failed breakdown could be the catalyst that sends prices through that tough overhead resistance near 34500. The longer we’re below 33000, though, the more likely it is that stock prices overall will retest their October lows.
Premium members can log in to see our sector ratings and US Equity Model Portfolio below.
or
View the rest of our March outlook:
March Technical Market Outlook
Fixed Income, Currencies, and Commodities
Communication Services Sector
Consumer Discretionary Sector
Consumer Staples Sector
Energy Sector
Financials Sector
Health Care Sector
Industrials Sector
Information Technology Sector – Unlocked
Materials Sector
Real Estate Sector
Utilities Sector
(Premium) February Technical Market Outlook and Equity Playbook
Stocks got off to one of their best starts ever in January. With every passing day, the climb looks less like a bear market rally and more like the start of a new bullish era. We aren’t out of the woods yet, but we think we see the light at the edge of the forest.
US Equities
We start our monthly technical outlooks at the top for a reason. In just a handful of charts, we can see exactly the type of investment environment we’re in. Are stock prices rising or are they falling? Should we be erring on the side of buying or selling stocks?
Last month, we had this to say about the world’s most important stock index:
The S&P 500, a market cap-weighted index comprised of 500 of the biggest companies in the United States, is stuck below a falling 200-day moving average. At best, prices are stuck in a sideways trend. The line in the sand for the SPX is 4100. That’s the 161.8% Fibonacci retracement from the entire COVID selloff, and that’s been overhead resistance since May. If we’re above that, we’ll be looking for stocks to buy. As long as we’re below it, we need to err towards caution.
Since then, the index has surpassed its 200-day. That’s one point for the bulls. But we haven’t surpassed the resistance area near 4100. The bears have the upper hand unless and until that level is taken out.
(Editor’s note: If you’re having trouble seeing any chart in this report, click on it to view a larger version)

We’re watching closely, because a few more days like the last would quickly push us above it and give us confidence to flip from a neutral stance to one that’s more bullish overall. Remember, our goal is not to nail tops or bottoms, but to catch the middles of big trends. IF this is truly the start of a new, multi-year bull market, we can afford to wait for that confirmation.
It’s the exact same situation for the Dow and the Nasdaq. The Dow Jones Industrial Average has so far been unable to absorb all this overhead supply between 34000 and 35000. It wouldn’t take much to get a breakout, but this editor is from Missouri. It’s gotta show me.

The level for the NASDAQ is 12000. That’s the 161.8% retracement from the 2020 selloff and the September 2020 peak, which marked the beginning of a regime shift as value stocks took the lead from growth. If the NASDAQ is above 12000, we can confidently be buying stocks.

Small Caps are the ones to watch. With the last few days of gains, the Russell 2000 is above its own key area of resistance. That’s a good sign – small caps were the first to find a bottom last year and could very well lead us higher in 2023. But if IWM is back below 190, expect the rest of the major US indexes to be failing, too.

Click on each section below to see the rest of our February outlook:
Fixed Income, Currencies, and Commodities
Communication Services Sector
Consumer Discretionary Sector
Consumer Staples Sector
Energy Sector – UNLOCKED
Financials Sector
Health Care Sector
Industrials Sector
Information Technology Sector
Materials Sector
Real Estate Sector
Utilities Sector
Premium members can log in to see our sector outlook and US Equity Model Portfolio below:
Sector Ratings Update and Model Portfolio Changes
The start of 2023 has brought about a shift in market leadership. As such, we’re making the following changes to our sector ratings and updating our US Equity Model Portfolio to reflect those changes.